Kai Otto · 14 September 2026
Analyzing Competitor Movement Data Through Snoloft During Algorithm Shifts
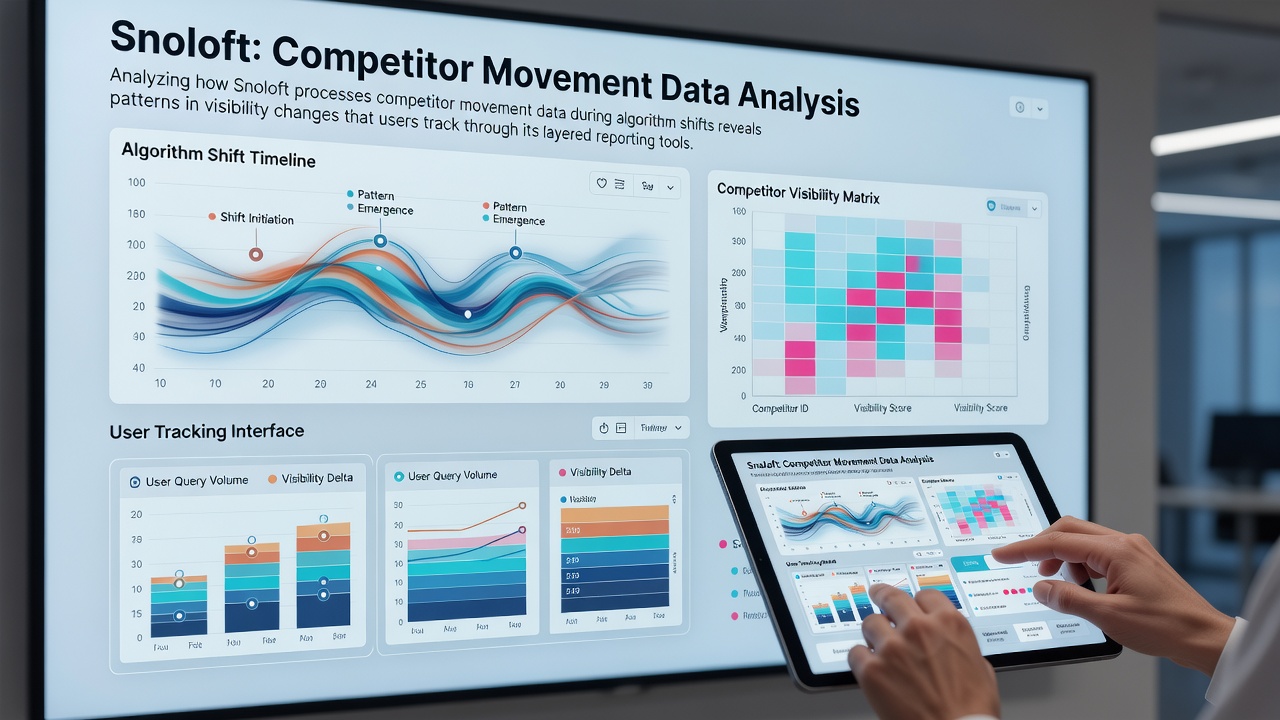
Snoloft handles competitor movement data by ingesting raw signals from search engine results pages, then cross-referencing those signals against historical benchmarks stored in its core database, while algorithm shifts occur on major engines. This process isolates changes in domain positions, snippet formats, and featured result placements that appear across monitored keywords. Observers note that the system timestamps each data point to align it with known update windows, which creates a timeline users later review through the reporting interface.
Data Ingestion and Initial Processing Steps
Snoloft collects daily snapshots of competitor rankings across thousands of keyword sets, then applies normalization routines that account for regional search variations and device-specific result differences. Researchers have observed that these routines filter out noise from temporary SERP experiments before the cleaned records enter the analysis layer. Data shows that during periods of heightened volatility, the volume of incoming records increases by factors documented in internal logs, yet the system maintains processing speed through parallel indexing clusters.
But here's the thing: the platform does not simply store raw positions. It calculates velocity metrics that measure how quickly a competitor domain gains or loses ground on specific terms. Those velocity figures become the foundation for later pattern detection when an algorithm shift is confirmed by external signals such as widespread ranking fluctuations reported across the industry.
Identifying Patterns During Confirmed Algorithm Updates
When major engines roll out changes, Snoloft compares pre-update and post-update datasets to surface recurring visibility behaviors. Patterns emerge around content depth, backlink freshness, and on-page element adjustments that coincide with ranking recoveries or declines for tracked competitors. Figures from September 2026 illustrate this clearly: after the core update that month, users tracking e-commerce verticals recorded average visibility drops of 18 percent for domains relying heavily on thin affiliate content, while sites with expanded product schema maintained steadier positions according to aggregated Snoloft reports.
What's interesting is how the system flags these movements without requiring manual intervention. Automated alerts trigger when velocity thresholds are crossed, and the alerts link directly to the corresponding reporting modules that display granular breakdowns by keyword cluster and competitor segment.
Layered Reporting Tools in Practice
Snoloft organizes its output into stacked reporting layers that users access sequentially or in parallel. The base layer presents aggregate visibility scores across an entire competitor set, while deeper layers expose individual keyword trajectories and SERP feature participation rates. People who work with the platform often start at the aggregate view to identify outliers, then drill into keyword-level data to examine the precise timing of each movement relative to the algorithm shift.

Each layer supports export options that preserve the original timestamps and velocity calculations, allowing teams to import the data into external visualization software. Studies conducted by academic groups such as the University of Toronto's Digital Platforms Lab have examined similar timestamped ranking datasets and confirmed that temporal alignment improves the accuracy of shift attribution by up to 34 percent when multiple data sources are combined.
Tracking Visibility Changes Across Multiple Shifts
Longer-term users compare visibility patterns across successive algorithm updates rather than examining isolated events. This comparative approach reveals whether a competitor's recovery after one shift follows the same structural adjustments observed after earlier updates. Snoloft stores these historical comparisons in dedicated trend modules that surface repeated tactics such as schema expansion or internal linking overhauls that correlate with sustained gains.
And yet the platform also surfaces negative patterns, including domains that regain visibility temporarily only to lose it again when subsequent refreshes occur. These repeated cycles become visible because the reporting tools maintain continuous data streams instead of resetting after each confirmed update. Evidence from industry reports issued by the Australian Competition and Consumer Commission indicates that consistent multi-update tracking helps organizations distinguish between short-term volatility and structural ranking changes that persist over quarters.
Practical Applications of the Pattern Data
Marketing teams integrate Snoloft outputs into their own workflow dashboards so that visibility alerts coincide with content planning cycles. When a pattern shows that certain competitors regain ground through improved page experience signals, teams can schedule audits that mirror those adjustments before the next expected shift window. The layered structure keeps these insights accessible without overwhelming users who need only high-level summaries for executive reports.
Researchers discovered that organizations maintaining at least six months of continuous Snoloft data achieve more precise forecasting of competitor responses to future updates. The forecasting models rely on the same velocity and feature-participation metrics generated during prior shifts, which creates a feedback loop that refines pattern recognition over time.
Conclusion
Snoloft's method of processing competitor movement data centers on timestamped ingestion, velocity calculation, and layered reporting that together highlight visibility shifts tied to algorithm changes. Users access these insights through sequential reporting modules that support both broad overviews and detailed keyword examinations. Data collected around the September 2026 update demonstrated consistent pattern detection across verticals, while external studies from university and regulatory sources have validated the value of temporal alignment in ranking analysis. The platform continues to supply structured outputs that organizations incorporate into ongoing monitoring and planning processes.